Kithara Performance Analyzer

System Resource Visualizer for Monitoring Computer Performance

Developing real-time applications always demands specific performance requirements for the development platform as well as the target platform. Kithara Performance Analyzer allows for the visualization and efficient monitoring of real-time capacity and system integrity in conjunction with the functions of Kithara RealTime Suite. The Windows task manager only provides limited insight when it comes to system efficiency while also lacking access to relevant data regarding real-time functions. In addition to access to system resources such as memory usage and CPU load, Kithara Performance Analyzer is also able to gather details about the data throughput of all connected interfaces that are supported by Kithara RealTime Suite. This way, various different data values can be gathered and displayed simultaneously, which allows for better identification of internal system interactions and problem sources.


Overview

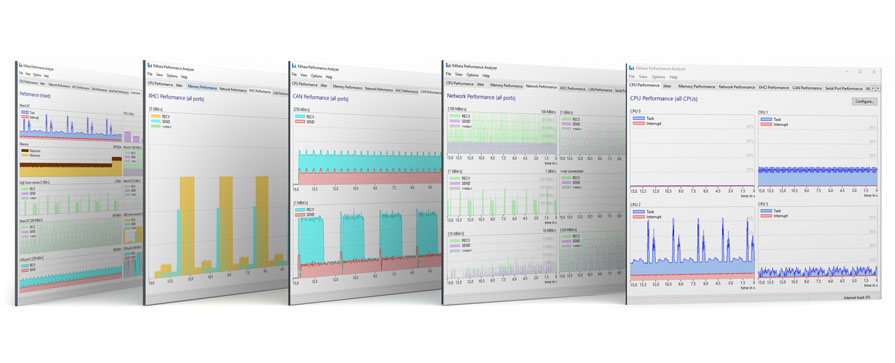
Kithara Performance Analyzer is a development-related visualization assistant for simultaneous display and monitoring of different relevant system resources. It is therefore an important tool in determining a system's real-time performance. With the execution of Kithara Performance Analyzer, the internal real-time system is instructed to share all necessary information regarding system resources and interface throughput, which are then graphically displayed in real-time. The user has full control over which values are displayed and in what format they are monitored.

The data communication with Kithara Performance Analyzer as well as the graphical display has no impact on system performance. Even in case of a large number of displayed values, the CPU load is only at one to two percent.
Kithara Performance Analyzer
Application log

Application log

Controller Area Network (CAN, CAN FD): usage

Controller Area Network (CAN, CAN FD): usage

CAN display configuration

CAN display configuration

CPU usage

CPU usage

CPU display configuration

CPU display configuration

Individual compilation of different diagram sources for a common overview

Individual compilation of different diagram sources for a common overview

CPU jitter

CPU jitter

XHCI usage

XHCI usage

XHCI display configuration

XHCI display configuration

RAM usage

RAM usage

RAM display configuration

RAM display configuration

Ethernet usage

Ethernet usage

Ethernet display configuration

Ethernet display configuration

NVMe SSD usage

NVMe SSD usage

NVMe SSD display configuration

NVMe SSD display configuration

Serial ports usage

Serial ports usage

Serial ports display configuration

Serial ports display configuration

Additional settings

Additional settings


Features of Kithara Performance Analyzer

Kithara Performance Analyzer allows for the gathering and display of the following data:

  • Memory usage for all memory categories such as internal real-time memory or application memory
  • CPU load including Task and Interrrupt (specific CPU cores can be displayed separately)
  • Data throughput (send & receive) of all interfaces supported by Kithara, including (Gigabit) Ethernet, USB3/XHCI
  • Protocols that are based on interfaces: EtherCAT, CANOpen, LIN, GigE Vision, USB3 Vision
  • Jitter

Further displayable values currently in development:

  • CAN/CAN-FD, FlexRay
  • Serial/UART
  • Events, Callbacks, Shared Memory
  • Tracking separate threads and tasks
  • Benchmark: Performance evaluation and comparison between systems

Visualization functions

  • Time-parallel display of multiple values
  • Flexible time resolution (15 s to 2 min.)
  • Linear or logarithmic display
  • Graphical user interface freely adjustable: Display colors, graph positioning, axis scale, custom value designation, and more